You don’t need to be reminded that we’re currently operating in an unprecedented global environment. The current situation seems surreal and unpredictable. We hear the word ‘corona’ ten times more than we do ‘Brexit’ now. To put this into perspective, the term ‘Coronavirus’ has broken google trends records; searches for Donald Trump and Brexit during peak interest score microscopic in comparison.
Prior to the market drops spurred by the COVID-19 pandemic, numerous investors had not experienced a bear market before, and many others hadn’t accrued such a substantial wealth when the market dipped this low in 2008.
Investors respond in different ways during periods of market turbulence. Investors are human after all and can react somewhat emotionally to a constant stream of market updates bound to provoke your typical ‘fight or flight’ responses. These are illustrated by UK funds suffering their highest withdrawals since 2015 and money flowing to ‘safe haven’ assets such as government bonds and cash.
Others, on the contrary, seek solace through trusted advisers and sources of information. And this also shows in the numbers. In the past month, we have seen a 157% increase in Trustnet news page views from investors, in comparison to the same period last year. Similarly, unprecedented calls for data via FE Analytics and FE Analytics FinXL were recorded as financial advisers sought to comfort investors with sound insight backed by the whole of market data.
Perspective is an important commodity
Market tracking has never been more vital and thankfully, technology can uphold our ability to remain fully informed, connected and operational during this period of isolation. Those who continue to prosper in this climate will be the ones who adapt to the changing circumstance and maximise the resources at their disposal.
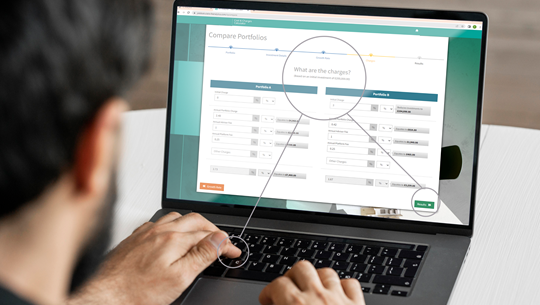
FE Analytics offers whole-of-market data coverage and powerful analysis to explore the position of funds in the market from a variety of angles.
The chart below demonstrates how you can use the Fund Within Sector edition of our popular Bar Charts; to observe where a fund has sat in relation to sector peers based on 18 widely varied metrics. In this example, we consider the position of a single fund within the UK Equity Income sector over the past 4 quarters against its peers, in terms of volatility.
The point where the bars meet is the sector average for volatility in each period, with the blue section of the bar encompassing results recorded over that sector average by peers, and the red section encompassing those under it. The fund is represented by a yellow line – we get a simple but powerful visual to illustrate where this fund has sat relative to both its peers, and the average, in terms of volatility in its sector.
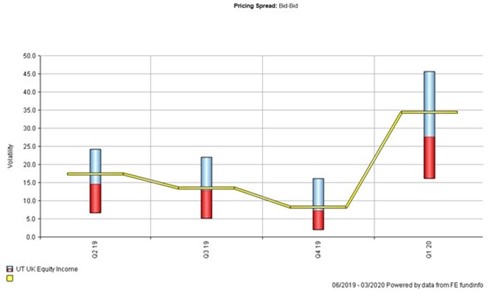
Source: FE Analytics
Data gives us perspective
Whilst the perimeter for fund comparison on FE Analytics is set at a 12-fund limit, FE Analytics FinXL can help with larger data extractions. The extraction of raw data gives fund managers the flexibility and control to conduct more in-depth, more granular analysis through FE Analytics FinXL.
We are conducting a series of webinars to help you maximise the use of our fund research and analysis tools.