Selecting your clients' investments is just the beginning of your work as their adviser. Arguably, the greater and more time-consuming part of the process is in the monitoring and review of their portfolios to ensure they are progressing towards their chosen financial goals.
There is of course a myriad of ways to assess the relative performance of your clients’ portfolios and the exact measures you use will depend on their investments and the types of information you're looking for. However, even the simplest method of measuring performance, such a measuring a portfolio against a chosen benchmark, can become a complex process without access to the right tools. For example, you may want to compare a portfolios’ performance over contrasting time periods or review it using a rolling time frame rather than discrete periods, which can be time-consuming without an automated process.
Finding and applying the right evaluation standards for your investments is also important and having the flexibility to compare your clients’ portfolio against different types of benchmark is key. It might not be appropriate to benchmark your portfolios against a single index, as the desired level of risk may differ. Alternatively, you may want to ensure you’re comparing the performance with a benchmark that has the same investment aim, such as growth or income, as they will also have different success metrics.
Being able to compare performance against a wide range of sources can add more context to your analysis."
FE Analytics, the award-winning fund research and analysis platform, allows you to compare against a full range of index and sector benchmarks and gives you access over 300,000 instruments including UT & OEICS, ITs, Offshore, Onshore and DFMs to shortlist funds. It has a huge range of sophisticated charting tools and pricing information is always right up to date so you can ensure you are always analysing reliable fund data. FE Analytics/ Risk Scores allow you to accurately gauge the true relative risk of your clients’ investments and includes any diversification benefits gained across the portfolio.
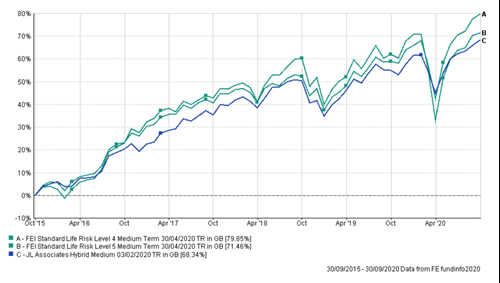
Understanding how a portfolio has performed versus its appropriate peer group is essential but many advisers find it particularly hard to track the performance of their discretionary managed funds and are reliant on direct data from the providers. FE Analytics’ MPS Directory gives you access to data from over 50 model portfolio providers, allowing you to plot the performance of your chosen model providers against each other, all within one research tool.
If nothing else 2020 has reinforced the importance of managing risk and with the final shape of Brexit still undecided and the corona crisis unresolved, 2021 looks set for continued uncertainty. Understandably, clients are more nervous about their investments in these circumstances and look to their financial adviser to provide reassurance. One way to provide this is by stress-testing your clients’ investment portfolios. This not only helps identify risks but can also demonstrate to them how their portfolios might react to market movements or your suggested changes.
The FE Analytics Dynamic Portfolio Tool allows you to compare any instrument against any other so you and your client can better understand the effect of proposed changes to a portfolio or see how a fund might perform against its benchmark or peers. You can even compare the projected returns of a client’s current portfolio against your suggested investment model.
Finally, it’s also important to keep an eye on the real performance of a portfolio, including the various costs and charges. Calculating this is not an easy task considering the number of different charges and the reliance on cost projections from product providers. Our Reduction in Yield calculator helps you assess the impact of costs on a portfolio by calculating the reduction in its yield after set up charges, ongoing charges, adviser charges, provider and fund charges, and includes any DFM model portfolios you have access to. The calculator is fully integrated into FE Analytics, sitting alongside all your fund and portfolio data, making your required calculation quick and easy to performance.
FE Analytics is a complete research toolkit available in a single resource. It gives you access to a huge range of sophisticated charting tools to help you analyse performance and risk - providing you with more time to focus on managing your existing client base and to take on new clients.